Lesson 07 – Pixels
Schedule
| Time | Desc |
|---|---|
| 00:00 – 00:15 | Intro |
| 00:15 – 00:30 | Sharing |
| 00-30 - 01:00 | Work on assignement |
| 01:00 - 01:10 | Break |
| 01:15 - 02:00 | Work on assignement |
| 02:00 - 02:15 | Wrap up |
🎯 Focus
Use pixels as raw generative material.
Content
Brief
Write a program that treats pixels as raw material for creating original designs. Load an image, access its pixel data (colors, positions), and use that information to generate something new. Think carefully about the relationship between your pixel concept and the image you choose to transform. 1
Note: This is about working directly with pixel-level data in code. Instead of drawing shapes that the computer renders into pixels, you’re reading pixel values from an image and using that data to create new visual outputs.
Key questions to explore:
- What if pixels had different shapes?
- What if they were arranged differently than in a grid?
- What if they could be represented in a completely different form?
- How can pixel data (color, brightness, position) drive visual generation?
What does “pixels as material” mean?
When you normally code graphics, you work with shapes and the computer handles the pixels:
You think: "Draw a red circle"
Computer does: Calculates which pixels to color red
Today, you’re flipping this - you work directly with the pixel data itself:
You access: The actual color values of each pixel in an image
You decide: What to do with that information
You create: A new visual representation based on pixel data
The conceptual shift:
Drawing with shapes (what you’ve been doing):
-
circle(x, y, size)→ computer figures out the pixels - You control geometry, computer handles rendering
Working with pixels (today):
- Access
img.pixels[i]→ read color values directly - You control what happens with that data
- Computer is just displaying your decisions
Basic workflow:
- Load an image → Get source material
- Access pixel array → Read the color/brightness data
- Extract information → What do you want from each pixel? (its red value? its brightness? its position?)
- Transform/remap → Use that data to create something new
- Display → Show your new interpretation
What can you do with pixel data?
Use pixel COLOR to control:
- Size of shapes (brighter pixels = bigger circles)
- Position of elements (red pixels go left, blue pixels go right)
- Rotation, transparency, or other visual properties
- Number of lines, particles, or repeated elements
Use pixel POSITION to:
- Rearrange pixels (sort by brightness, group by color)
- Map to different coordinate systems (polar, 3D, distorted grids)
- Create patterns (every 10th pixel, random sampling)
- Build new structures (pixel colors become vertices, heights, etc.)
Use pixel RELATIONSHIPS to:
- Compare neighboring pixels (edges, gradients)
- Find patterns (clusters of similar colors)
- Measure differences (contrast, change over time in video)
Thinking about image choice
The image you choose matters. Consider:
- High contrast images → Clear distinctions in brightness work well for sorting/clustering
- Colorful images → Rich color data for mapping to different properties
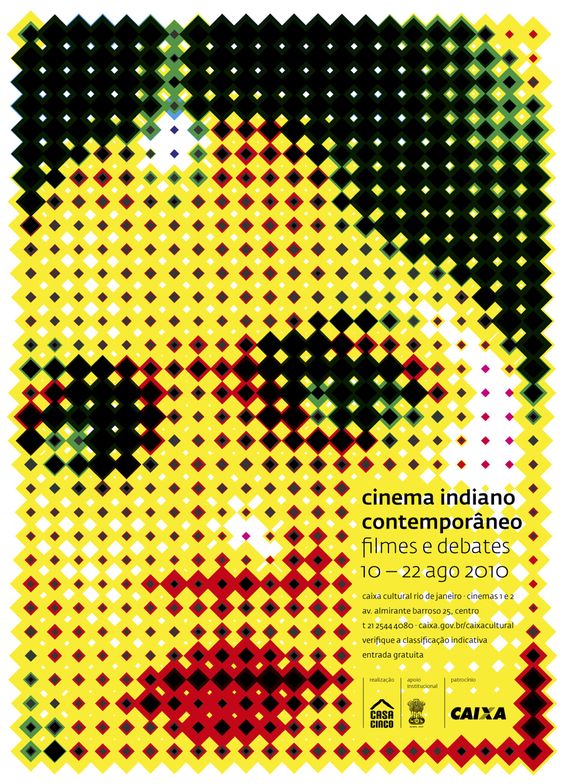
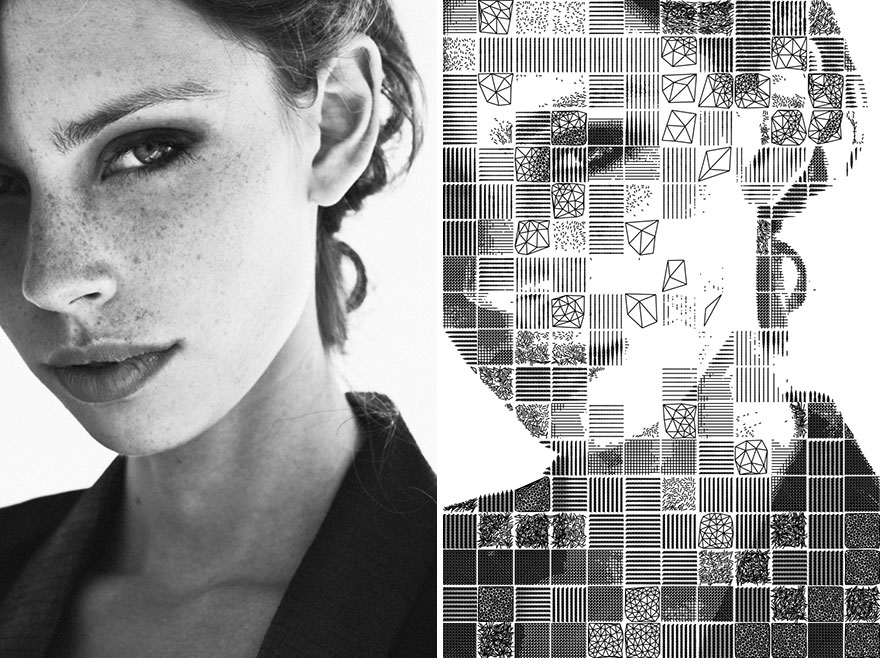
- Portraits → Recognizable subjects create interesting tensions when abstracted
- Textures → Repetitive patterns can be amplified or reorganized
- Your own photos → Personal connection to the source material
Ask yourself: What’s the relationship between the original image and your transformation? Are you:
- Abstracting (reducing the image to its data essence)?
- Amplifying (exaggerating certain qualities)?
- Reinterpreting (using the data to create something entirely different)?
- Revealing (showing hidden patterns or information)?
Concrete examples of pixel operations:
Simple level:
- Read each pixel’s brightness → draw a circle at that position, sized by brightness
- Sample every 10th pixel → use its color to draw a rectangle
- Sort all pixels by their red value → display them in a line
Medium level:
- For each pixel, draw a line pointing toward the brightest neighbor
- Group pixels by similar colors → create a mosaic of color clusters
- Use pixel brightness to control particle velocity in a system
Complex level:
- Build a 3D terrain where pixel brightness = height
- Create a generative brush that paints with pixel data from an image
- Map pixels to polar coordinates, creating spiral arrangements
- Use video pixels over time to create motion-based visualizations
Variations / Steps 1
- Use a different coordinate system to construct your image (Polar coordinates?)
- Make pixels behave as brushstrokes
- Use video or webcam (pixels changing over time)
- Play with compression - could you invent your own kind of compression?
- Sort or organize pixels by different criteria (brightness, hue, position)
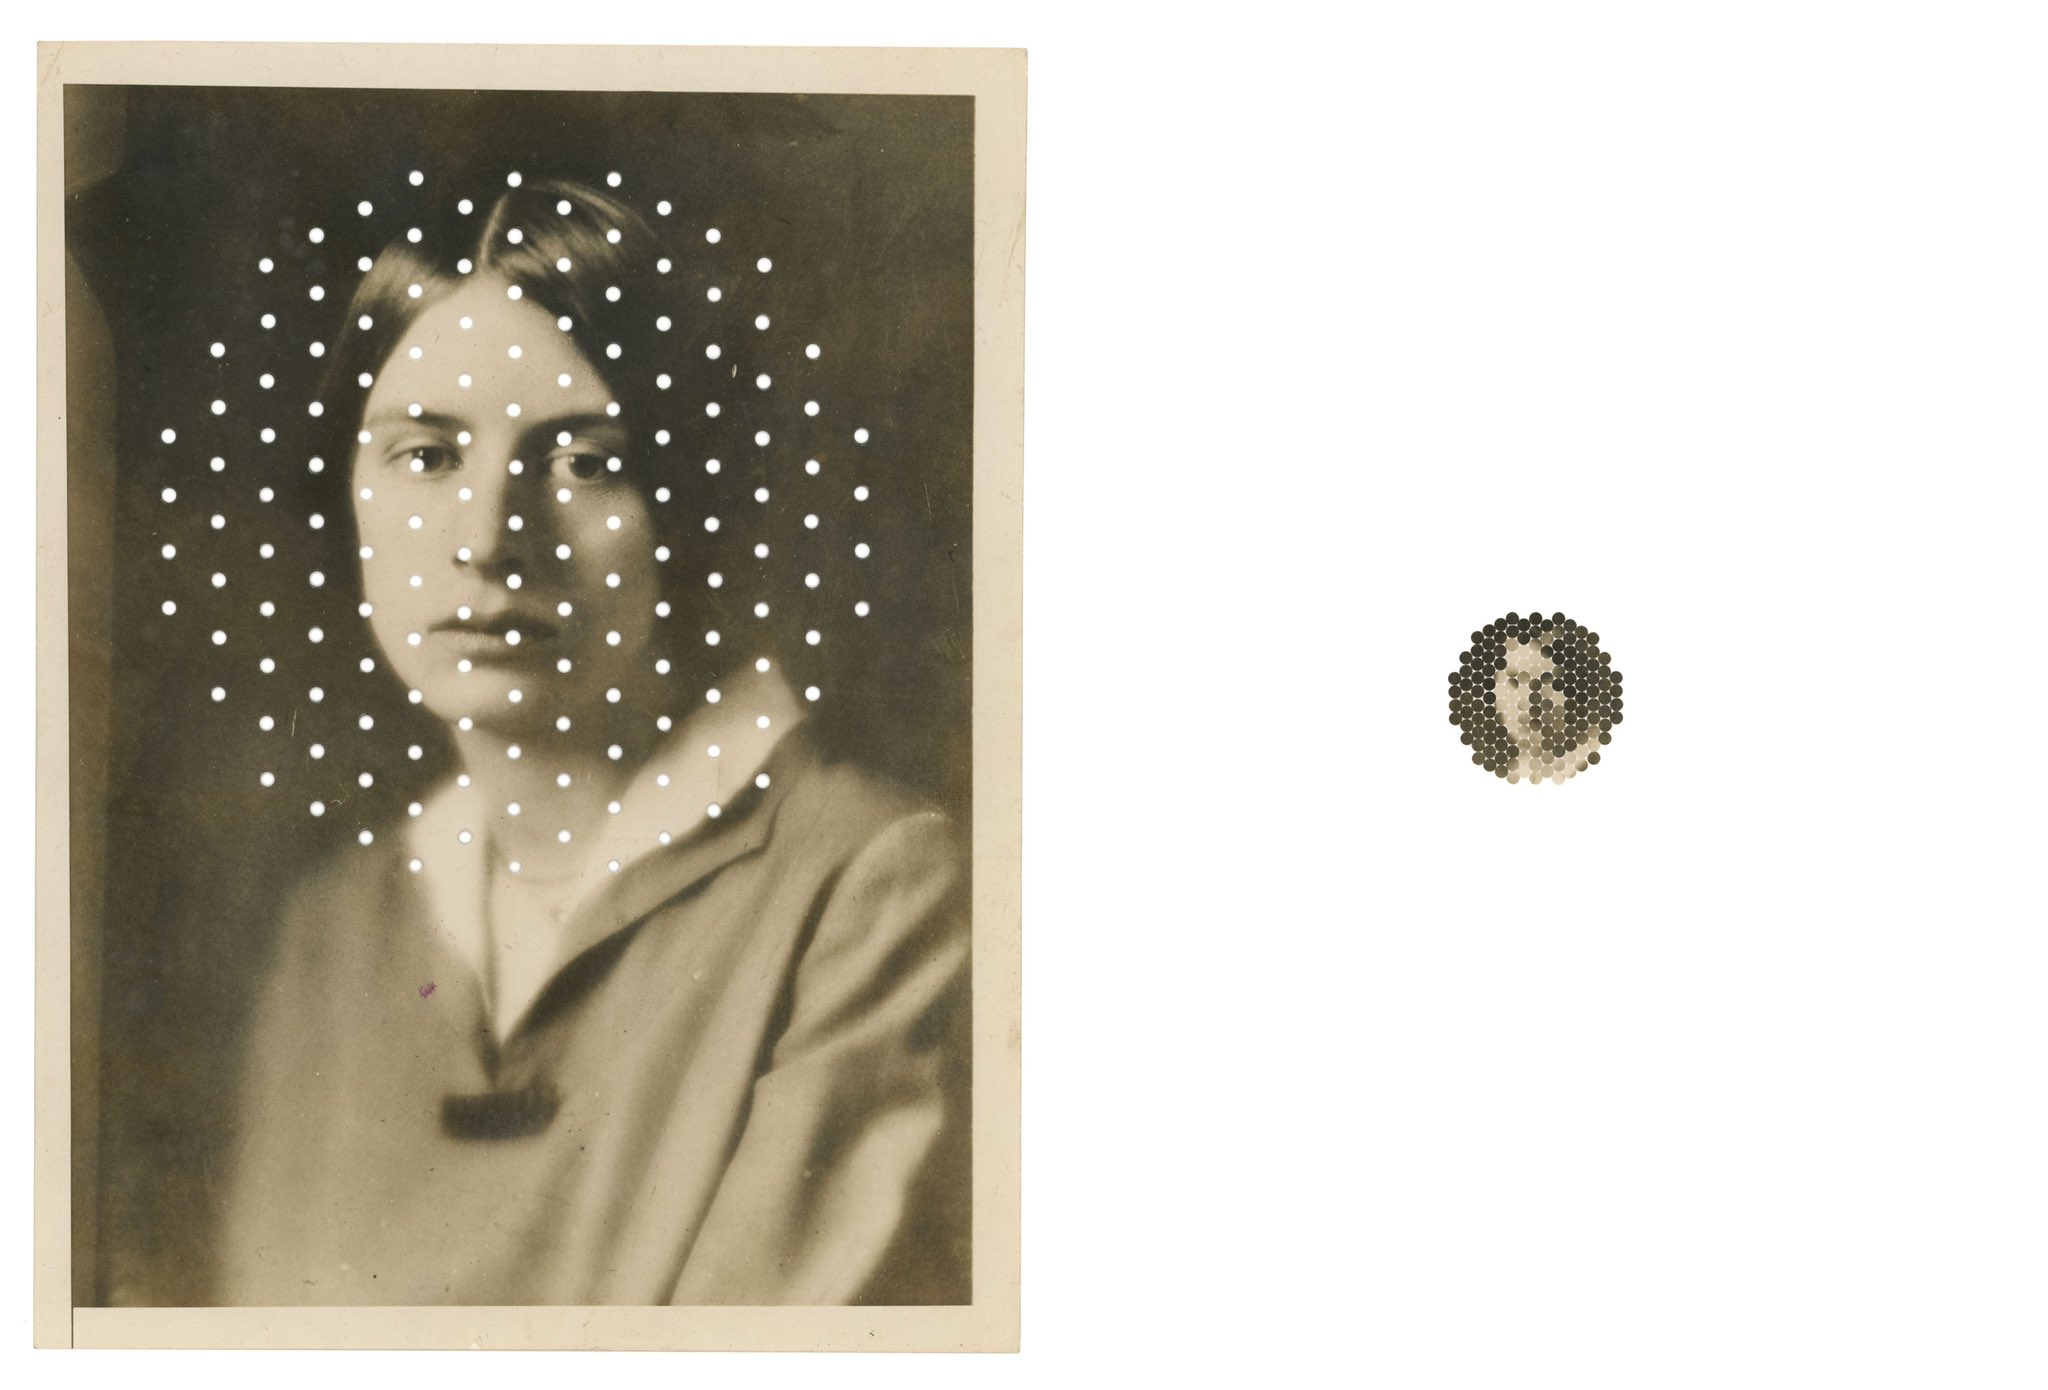
- Sample pixels sparsely - what’s the minimum information needed to recognize the image?
- Use pixel data to control a particle system or agents
- Map pixel colors to sound or other sensory output
References
The examples below show artists working with pixels as material - reordering, reinterpreting, and reimagining pixel data. Your task is to write code that reads pixel data and transforms it into something new.
1 –> Search pixels projects on CAN (username + password were sent on Slack yesterday)
2 –> Search fyprocessing for pixels projects, a lot of cool examples there ![]()
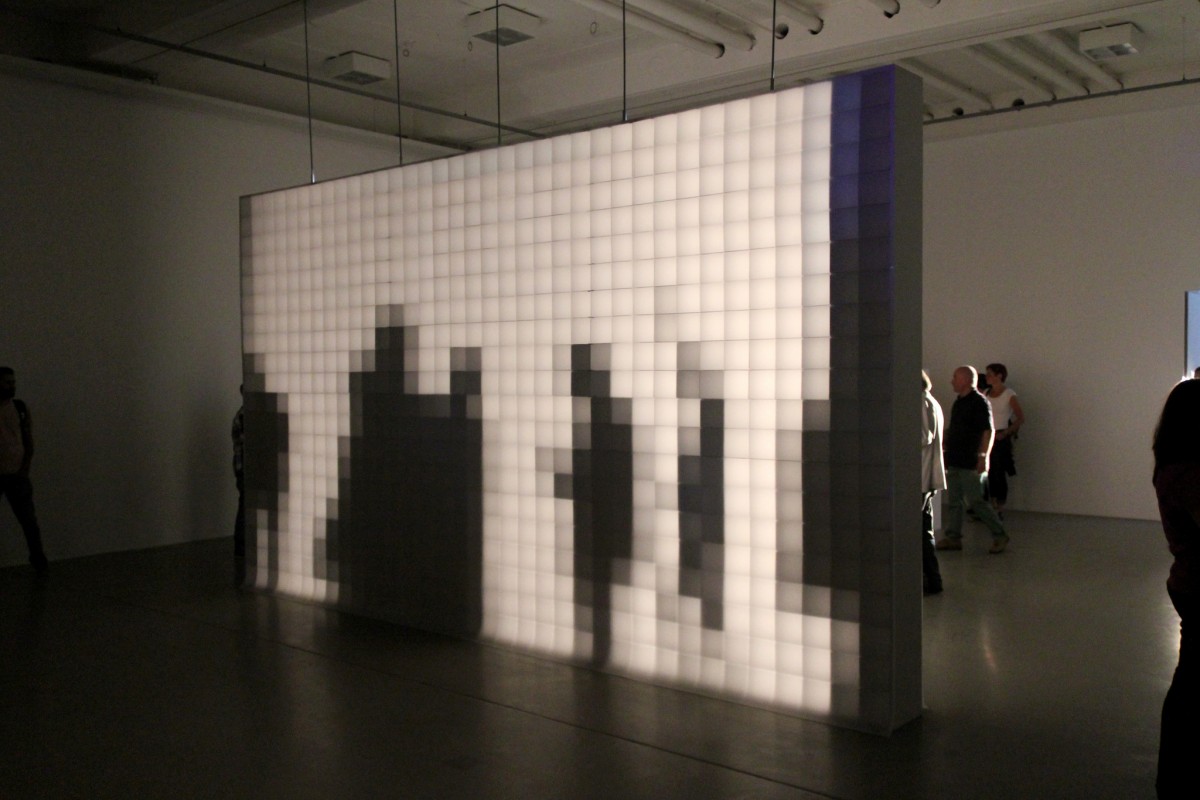
0,16 is a light installation in which the shadows of a passer-by is transformed into ‘pixels’. The installation consists of a wall built of small square frames covered front and back with transparent paper. A third layer of paper is attached in the centre of the frames. A lamp shining at a distance breaks the shadows of the passers-by into squares, allowing a pixellated human figure to be seen on the other site of the installation. In this simple way, Bartholl renders tangible the pixels found in the world of digital communications. The ‘resolution’ of the screen is 0,16 ppi (pixels per inch), hence the title.
![]()
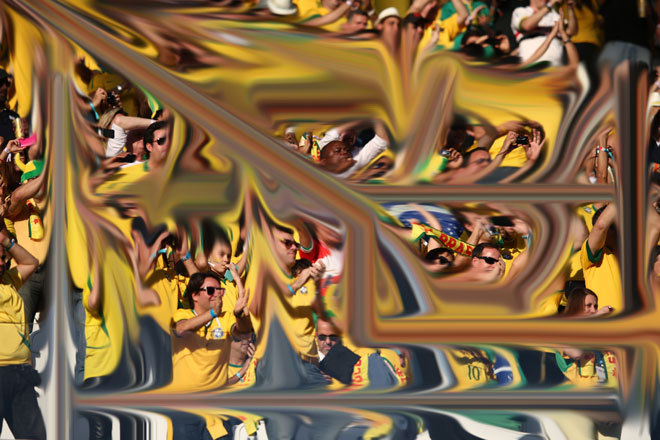
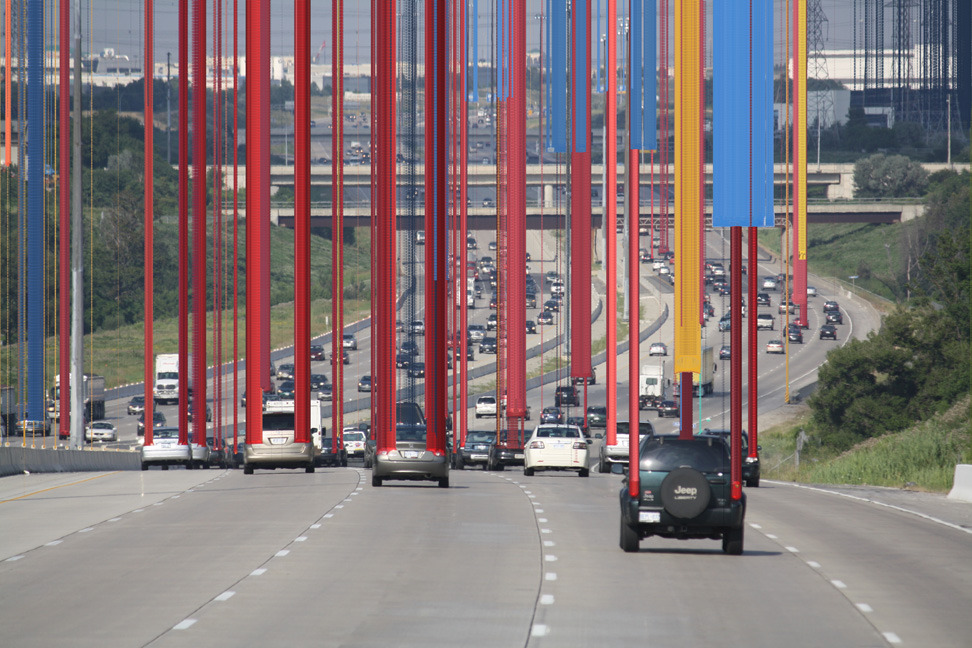
Pixel is Data - Matthieu Savary
Created by Matthieu Savary, Pixel is Data is not your ordinary photography app for the iOS. Instead of dealing with pixels as you’d expect, all in order to represent the scene you have just photographed, Pixel is Data uses the image data and shows it using various parameter to reorder the pixels. They can be arranged either the “right” way – their photographic order, or using the RGB components of each pixel to determine priority.
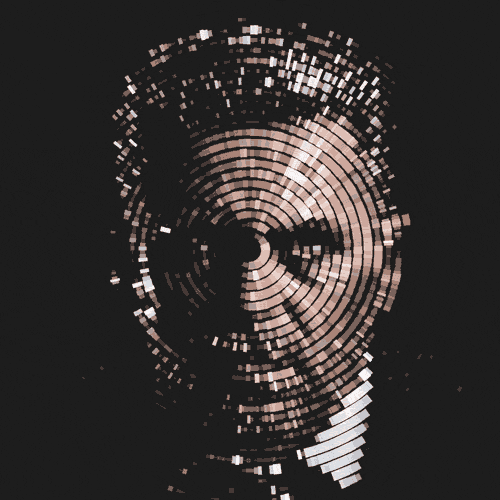
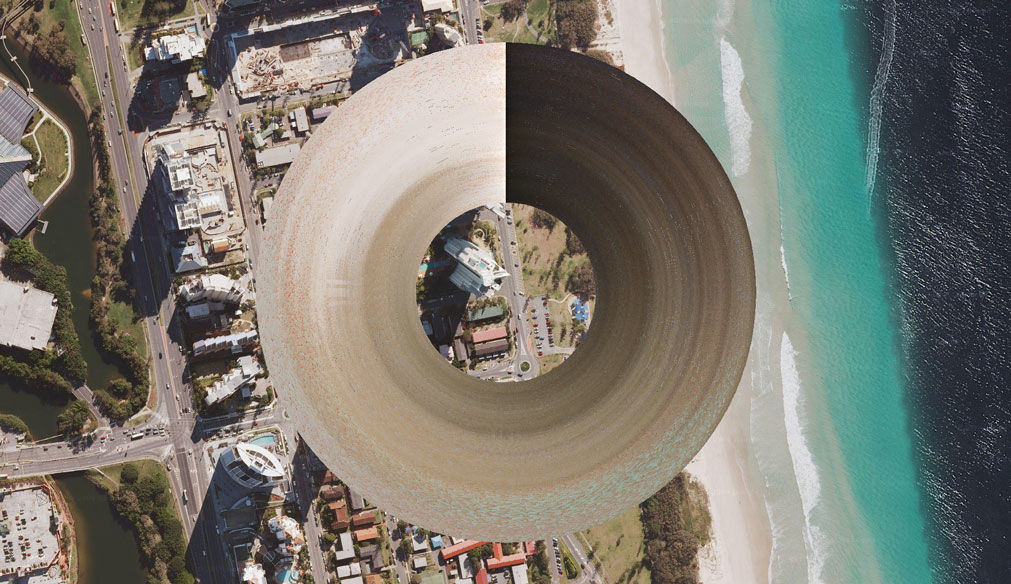
IRIS - Hybe
Created by Korean collective HYBE, IRIS is a media canvas with matrix of conventional information display technology, that is a monochrome LCD.Through the phased opening and closing of circular black liquid crystal, IRIS can create various patterns and control the amount (size) of passing lights.
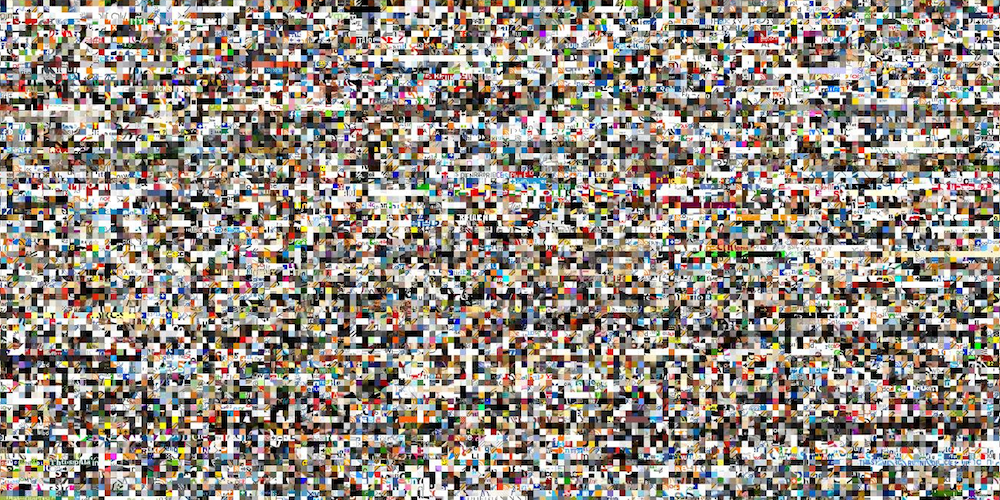
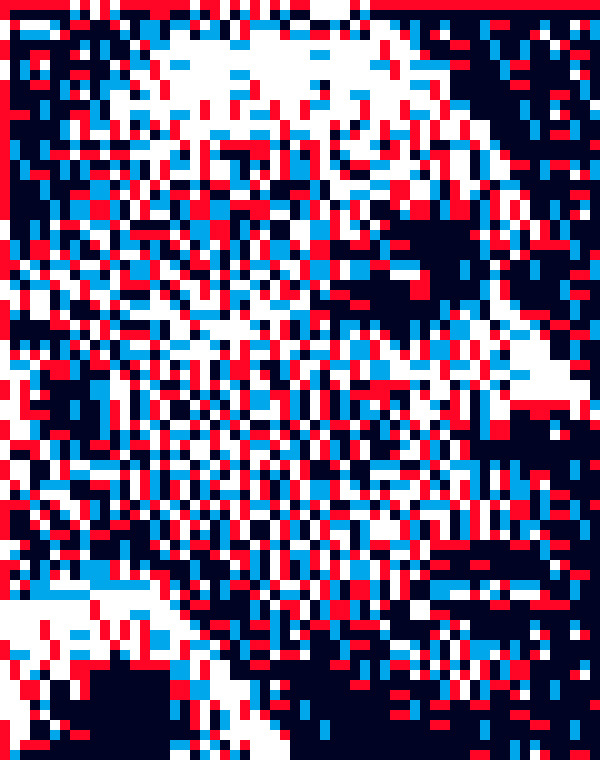
100.000.000 Stolen Pixels
100.000.000 stolen pixels is a personal project by Kim Asendorf in attempt to create an archive of numerous sites by ‘stealing pixels’ from them. A web crawler created by Kim started with 10 URLs (See first 10 in url.log) and searched HTML pages for images and hyperlinks. Each found image got downloaded and 100 pixels in a square of 10×10 were cut out of it. Each found hyperlink got stored in cache and thereby added to the list of searchable URLs.
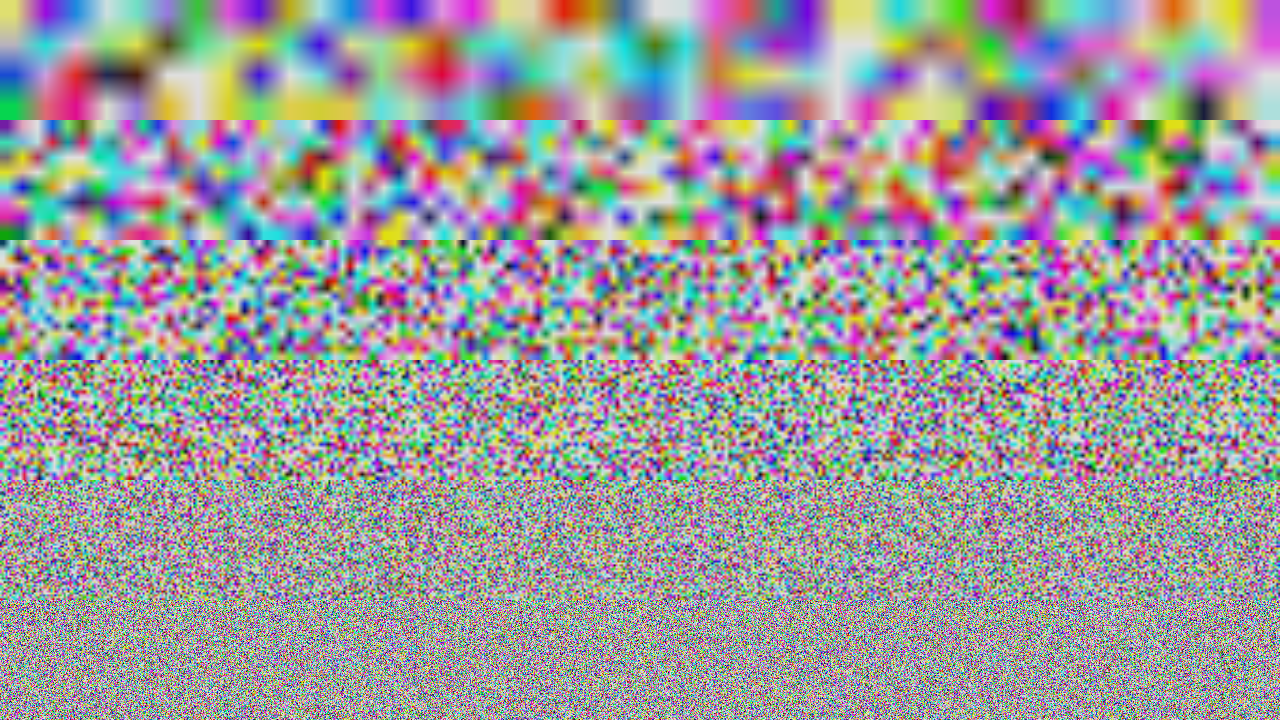
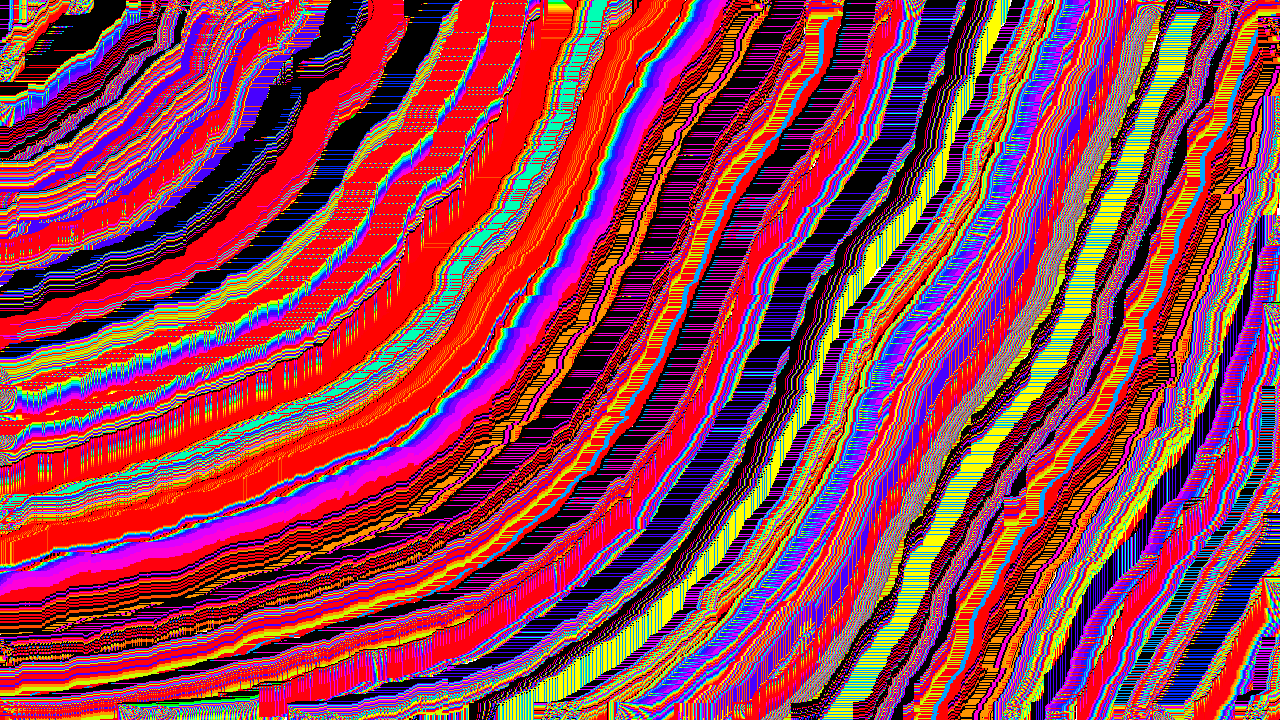
![]() KIM ASENDORF - Misc
KIM ASENDORF - Misc
You will find code examples in the book Generative Gestaltung (P4…)
CheckPinterest Portrait board
(username: tmp.pin@gmail.com password: TT4[bosses )
> Pinterest class board
Examples
See the Pen Demo 02 by G. (@gu-ma) on CodePen.
 Resources
- Really complete post on the topic - Check it out!
- Daniel Shiffman - Pixels Tutorial
- Generative Gestaltung example
📝 Activities
- Explore image → pixel grid manipulations.
- Code: pixel transformations (brushstroke, distortion, alternative coords).
- Share variations.
📂 Deliverables
- One pixel-based sketch with at least one variation.
- Documentation of process (show original image + transformation).
- Brief explanation of your pixel strategy.
📓 Journal Prompts
- How does treating pixels as material change your perception of images?
- What unexpected aesthetics emerged?
- What’s the relationship between your source image and your transformation?
- At what point does the original image become unrecognizable? Is that important?
🎨 References & Inspiration
- Aram Bartholl, 0,16
- Matthieu Savary, Pixel is Data
- Kim Asendorf, pixel sorting & glitch work